01
Agree the measure before designing the chart
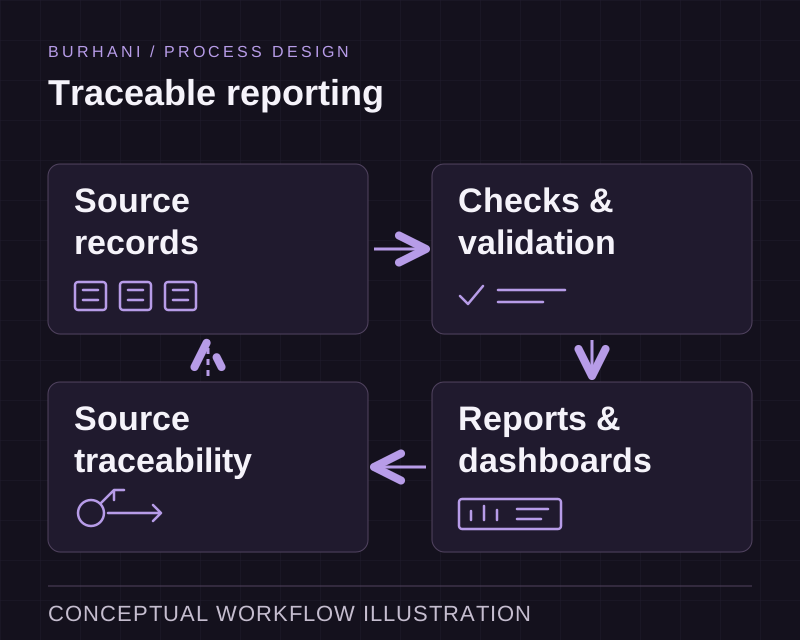
A completed order may mean dispatched to one department and paid to another. Resolve that definition and trace it to the source records before building the dashboard. Missing values, duplicate records and refresh intervals affect how the figures can be used.
ERP implementation can provide a shared operational foundation. Where records remain in separate tools, system integration establishes how they reach the reporting layer.
02
Check predictions against actual outcomes
Predictive analysis needs a defined decision, suitable historical records and a way to evaluate the result. Agree who reviews unusual outputs and how the team will compare forecasts with what happened. The underlying figures should remain traceable.
In AI-Powered Healthcare CRM & Monitoring, patient tracking and AI insights supported clinical review through dedicated dashboards. The data, review needs and intended use shape each reporting engagement.